
Reposted From ArcAngelCrowe.com
(Notice: This Article Is A Joint Effort By Research Conducted By Chrisley But Is Derrived Of A Partial Part Of Another Article Which Agrees With The Data But Has A Slight Apologetic Feel To It. Chrisley Nor Any Of His Organizations Or Properties Condones Nor Endorses Any Apologetics For The Races This Data Proves Most Responsible For Child Abuse Nor Does Chrisley Give Quarter To Any Child Abuse Regardless Of Race.)
(Methods, caveats, and what credible data actually shows)
Scope and definitions
- “Child maltreatment” combines neglect, physical abuse, sexual abuse, psychological abuse, and medical neglect. Sexual abuse is a small subset of total maltreatment in official reports.
- Most perpetrators in CPS data are parents or caregivers; race distributions therefore track the child population and residential segregation more than “stranger danger.”
- Comparing groups requires per-child rates (victims or perpetrators per 1,000 children), age structure, and consistent race/ethnicity categories.
The biggest ways the numbers get skewed
-
Counts vs. rates
Total counts (e.g., “most offenders are White”) mostly reflect population share. Use per-1,000 (or per-100,000) comparisons to avoid this error. [1]
-
Hispanic origin folded into “White”
Older federal series (e.g., legacy FBI UCR offender tables) collected race but not ethnicity for offenders, meaning “White” included Hispanic by default. This inflates the White category and depresses the Hispanic category. Newer NIBRS coverage is better, but still uneven across states. [5][11]
-
Different systems count different things
-
CPS/NCANDS (“Child Maltreatment” reports) track reports and substantiated cases—heavily influenced by reporting behavior and agency thresholds. [1]
-
NIBRS/UCR track crimes known to police, which depends on disclosure and police recording practices. [5][11]
-
Victimization surveys (e.g., NatSCEV) pick up unreported incidents, but rely on self-report and sample sizes. [10]
-
CPS/NCANDS (“Child Maltreatment” reports) track reports and substantiated cases—heavily influenced by reporting behavior and agency thresholds. [1]
-
Under-reporting of sexual abuse
Disclosure of child sexual abuse is notoriously delayed or suppressed; many victims never report to authorities. Under-reporting varies by family dynamics, stigma, fear of retaliation, and community trust in institutions. [8][3]
-
Socioeconomic confounding
Poverty, caregiver stress, substance misuse, prior victimization, and neighborhood disadvantage are strong predictors of maltreatment involvement and also correlate with racial disparities. Analyses that adjust for these factors reduce but do not always eliminate disparities. [2][7]
-
“Unknown” and missing categories
A nontrivial share of cases have unknown race/ethnicity for offenders, which can shift comparisons if you force distributional assumptions.
What major datasets consistently show
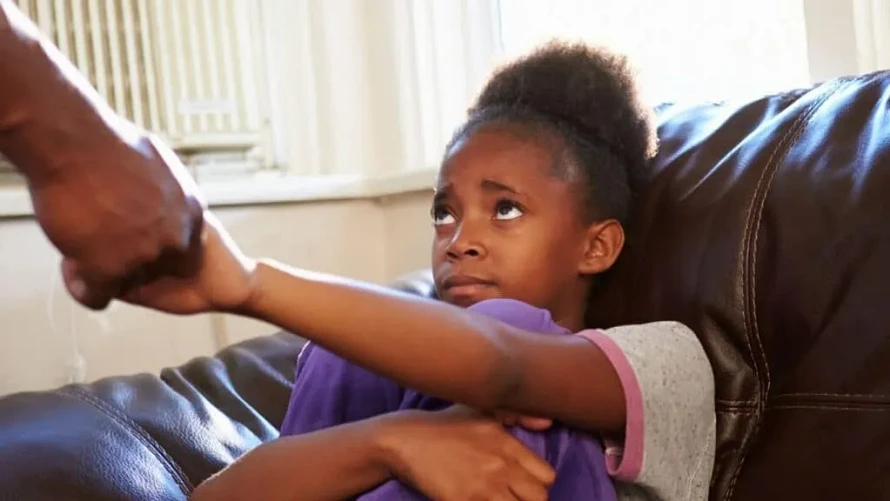
- In CPS victim data, Black children have higher per-1,000 victimization rates than White children across many years, with neglect driving most of the disparity. This is a per-capita fact in official NCANDS reports. [1]
-
Perpetrators in CPS data largely mirror the demographics of victims and caretakers: most are parents (often mothers for neglect, fathers/males for physical/sexual abuse). Race differences in perpetrator counts follow population share unless you convert to per-capita rates. [1][2]
- For sex offenses against minors reported to law enforcement, federal summaries show the majority of known offenders are acquainted with the victim (family or known nonfamily). Detailed race-specific, per-capita offender rates are rare and historically muddied by the Hispanic-as-White classification. [4][5][11]
-
Under-reporting is substantial for sexual abuse in all communities; research documents low disclosure rates, delayed disclosure, and recantation pressures. Differences in willingness to report and system contact (schools, hospitals, police) can inflate or depress observed rates by group. [8][3][10]
- The NIS-4 incidence study (independent of CPS substantiation thresholds) found higher maltreatment incidence for Black children than White children; adjusting for poverty and family/household risks narrowed but did not always eliminate the gap. [2]
About immigration/“illegal alien” claims
- National administrative crime datasets do not reliably capture immigration status of offenders; broad claims about “illegal immigrants” and specific crimes (including child sexual abuse) are not supported by consistent nationwide data. Where studied, overall crime rates among immigrants tend to be lower or comparable to natives; offense-specific rates are data-sparse nationally. Treat such claims as unverified unless linked to transparent, methodologically sound studies with clear denominators. [11]
How to make per-capita, apples-to-apples comparisons (without over-claiming)
- Choose a single source and year range (e.g., NCANDS “Child Maltreatment 2019–2022”).
- Use victimization rates per 1,000 children by race/ethnicity from the same tables.
- If examining perpetrators, confirm whether the report provides perpetrator rates (it often does not). If only counts are available, do not interpret as risk without constructing a denominator (e.g., number of caregivers/parents by race), which most reports do not provide.
- Avoid mixing CPS, police, and survey numbers in the same rate calculation; each measures a different slice of reality.
- Document whether the series treats Hispanic as an ethnicity separate from race, and whether offender ethnicity is collected. If not, flag “Hispanic-as-White” inflation as a limitation.

What you can safely say—based on long-running federal series
-
Per child, Black children experience higher CPS-measured maltreatment than White children across many years; this is not proof of inherent traits and is strongly intertwined with structural risk factors (poverty, stress, neighborhood disadvantage, prior victimization). [1][2][7]
- Claims about who “more often” commits child sexual abuse by race are methodologically fragile unless you (a) use per-capita denominators for offenders, (b) separate Hispanic ethnicity, and (c) account for under-reporting and case-processing differences. Most public datasets don’t let you do all three cleanly. [5][11][8]
- Older DOJ/FBI publications that reported “most offenders are White” are not evidence of higher White propensity; they reflect population share, ethnicity aggregation, and the absence of per-capita denominators. Treat those summaries as descriptive counts, not risk metrics. [5][11]
Sources & further reading (linked)
-
U.S. DHHS, ACF — Child Maltreatment (annual NCANDS reports; victimization rates per 1,000 children by race/ethnicity).
https://www.acf.hhs.gov/cb/research-data-technology/statistics-research/child-maltreatment
-
Sedlak, A. J., et al. (2010). Fourth National Incidence Study of Child Abuse and Neglect (NIS-4).
https://www.acf.hhs.gov/sites/default/files/documents/opre/nis4_report_photocopy.pdf
-
Finkelhor, D., & Jones, L. (various). Declines and trends in child sexual abuse; prevalence and reporting dynamics.
Center for Research on Crimes Against Children (UNH): https://www.unh.edu/ccrc
-
Snyder, H. N. (2000). Sexual Assault of Young Children as Reported to Law Enforcement: 1992–2000 (BJS, NCJ 182990).
https://bjs.ojp.gov/content/pub/pdf/saycrle.pdf
-
FBI UCR/NIBRS Offender Data — historical notes on race data and limitations (ethnicity often not collected for offenders).
Example overview: https://ucr.fbi.gov/crime-in-the-u.s/2019/crime-in-the-u.s.-2019/topic-pages/offender-data
-
CDC WISQARS & Vital Statistics — child injury and homicide mortality (context for maltreatment fatalities).
https://www.cdc.gov/injury/wisqars/index.html
-
Drake, B., et al. (2011). “Racial Bias in Child Protection? A Comparison of Competing Explanations Using National Data.” Pediatrics, 127(3), 471–478.
https://publications.aap.org/pediatrics/article/127/3/471/30007/
-
London, K., et al. (2005). “Disclosure of Child Sexual Abuse: A Review of the Contemporary Empirical Literature.” Child Abuse & Neglect, 29(5), 525–548.
(Publisher landing page accessible via journal search)
-
NSCAW — National Survey of Child and Adolescent Well-Being (federal longitudinal study of children involved with CPS).
https://www.acf.hhs.gov/opre/project/national-survey-child-and-adolescent-well-being-nscaw
-
NatSCEV — National Survey of Children’s Exposure to Violence (prevalence outside official systems).
https://www.unh.edu/ccrc/natscev
-
NIBRS Data Documentation — offender race/ethnicity fields and coverage caveats.
https://crime-data-explorer.fr.cloud.gov/about
Bottom line
- If your goal is to protect children, the strongest, defensible claims are about per-capita victimization (higher for Black children in CPS data) and the measurement problems that obscure true prevalence across communities (under-reporting, ethnicity misclassification, and mixed data systems).
not methodologically sound—nor ethically responsible—to assert that one race is “way more likely” to commit child sexual abuse. The data just don’t support that level of certainty, and pushing it can suppress reporting and harm kids.
#ChildProtection
#ChildSafety
#StopChildAbuse
#EndChildExploitation
#ProtectChildren
#DataTransparency
#JusticeForChildren
#TruthMatters
#CrimePrevention
#ProtectFamilies
#ChildAdvocacy
#PublicSafety
#Accountability
#ResearchBased
#ChildWelfare